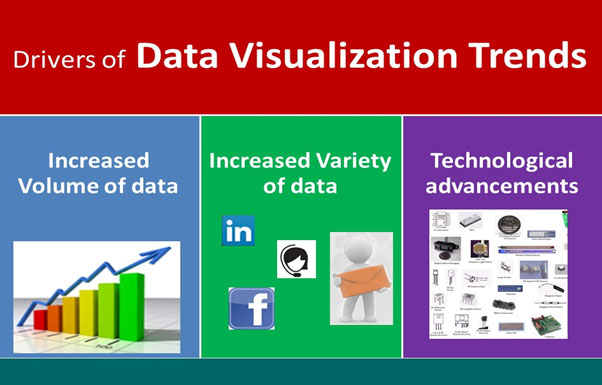
Data visualization has an important role in the field of information management. In order to make good decisions, you have to be able to understand and analyze available data. Sound data visualization techniques will help in achieving the desired results. And to stay ahead of the game, you need to know about the latest tools and trends in data visualization. With this perspective, we are looking forward to the new trends in data visualization. Read on to know more about the latest trends for 2017.
Image Source: https://www.analyticsvidhya.com/blog/2013/09/trends-data-visualization/
Predictive analytics involves extracting information from current and past data in order to forecast future possibilities. This tool helps in gauging what will happen in the future with an acceptable level of reliability, including a few alternative scenarios and risk assessment. Predictive analytics can be used in different industries. For example, Hotels may use it to foresee the number of guests they can expect on a particular night so as to adjust the room rates to maximize occupancy.
Prescriptive analytics uses the insights provided by predictive analytics and prompts a call to action based on findings. It analyzes current data for patterns and risks; evaluates the outcomes of the various scenarios that can crop up based on decisions made according to the informational data. This provides decision-makers with hypotheticals about the impact of each option. Only 10% of organizations currently use prescriptive analytics. According to Gartner, this will grow to 35% by 2020.
Just like running a business cannot be a one-man show, data visualization too, needs a host of people to collate data, organize and visualize it as well as to interpret and analyze it. This process may require many people with specific skill sets. As more and more businesses embrace data visualization, there is a lack of experienced people with the skills needed to excel in the field. However, SaaS products are a kind of easy to use software which provides all analytical functions with minimal training. Now you can expect more of data visualization SaaS products entering the market in 2017.
While the last few years were all about using 2D infographics for data visualization, 3D interactive images and moving pictures are the latest tools that advancement in technology has provided data visualizers. Due to this, there is a powerful shift towards animation and interactive visuals in data visualization. As we move ahead in 2017, the persuasive power of moving images is going to be another trend to watch out for.
The advancement in mobile technologies and the advent of smartphones and tablets has equipped data analysts and decision-makers to consume data anytime and anywhere. However, there are limitations such as inadequate data security and small canvas for visualizations. Therefore, the emerging trend would be to enable users to access data on their smart device but store the data on servers instead of the device itself. This will ensure there is no data theft in case the smartphone is lost.
Big data is incomprehensible and does not usually provide valuable insights on its own. Not all available data is valuable, so it is important to separate the seed from the clutter. We need to analyze the potential data sources and determine if we are selecting the best sources and the best angle for proper analysis. If we are not doing that, we can be certain that our competitors Therefore, more and more organizations are making this big data smaller and understandable through data visualization and visual analytics. The trend here is to make big data manageable and dependable by making available what is relevant to the user.